
The atmospheric CO₂ growth rate, resulting from CO₂ emissions from human activities and uptake by the land and ocean reservoirs.

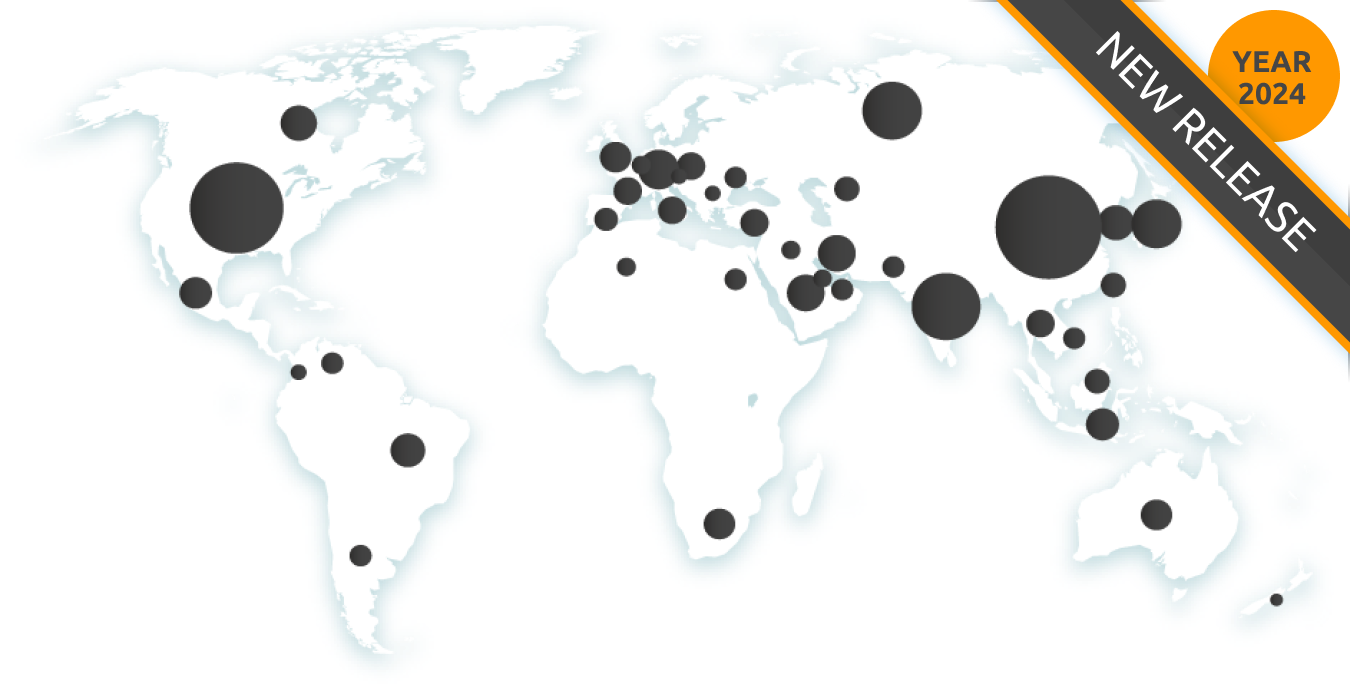
A new synthesis contributed by 68 research institutes, covers different regions and sectors, and the recent trends of methane emissions and sinks, using atmospheric observations and bottom-up models.

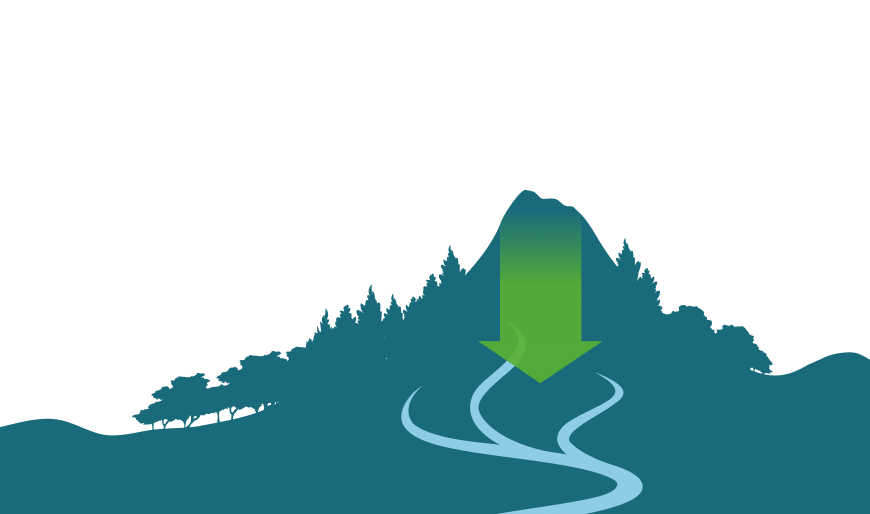
The journey of carbon from soils to oceans, leading to CO₂ outgassing by rivers and lakes. Data collected by the C-CASCADES project.
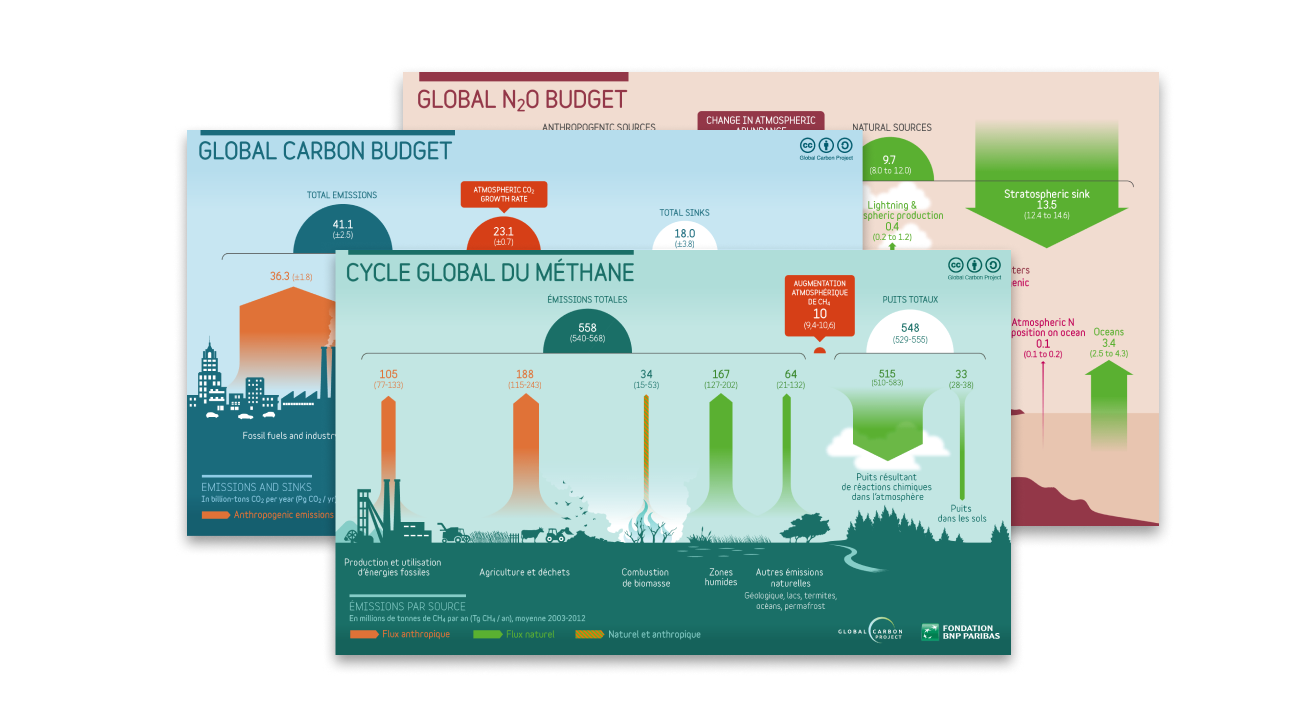

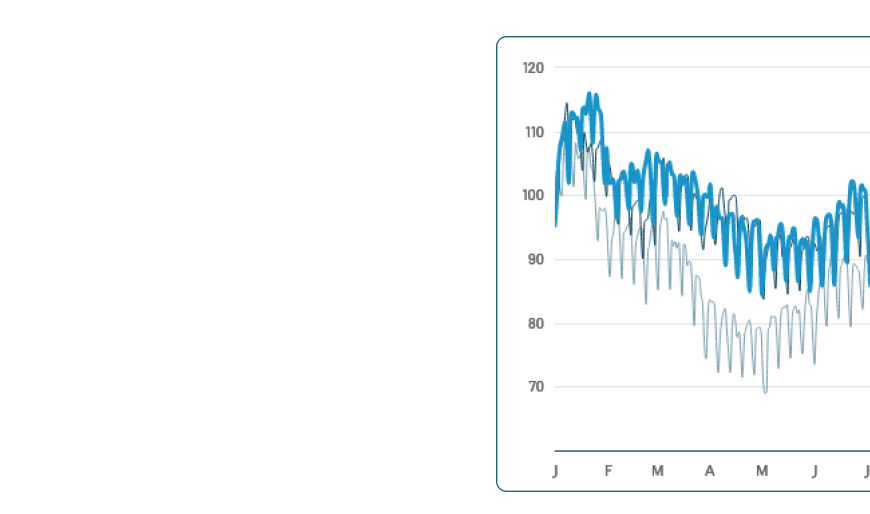

The atmospheric CO₂ growth rate, resulting from CO₂ emissions from human activities and uptake by the land and ocean reservoirs.
A new synthesis contributed by 68 research institutes, covers different regions and sectors, and the recent trends of methane emissions and sinks, using atmospheric observations and bottom-up models.
The journey of carbon from soils to oceans, leading to CO₂ outgassing by rivers and lakes. Data collected by the C-CASCADES project.
Discover how the unfolding COVID-19 pandemics is reducing emissions worldwide and across different countries and sectors.